Monday 16 November 2015

The Risk of Relying on a Single Data Source: A Lesson from NASA's MODIS Satellites

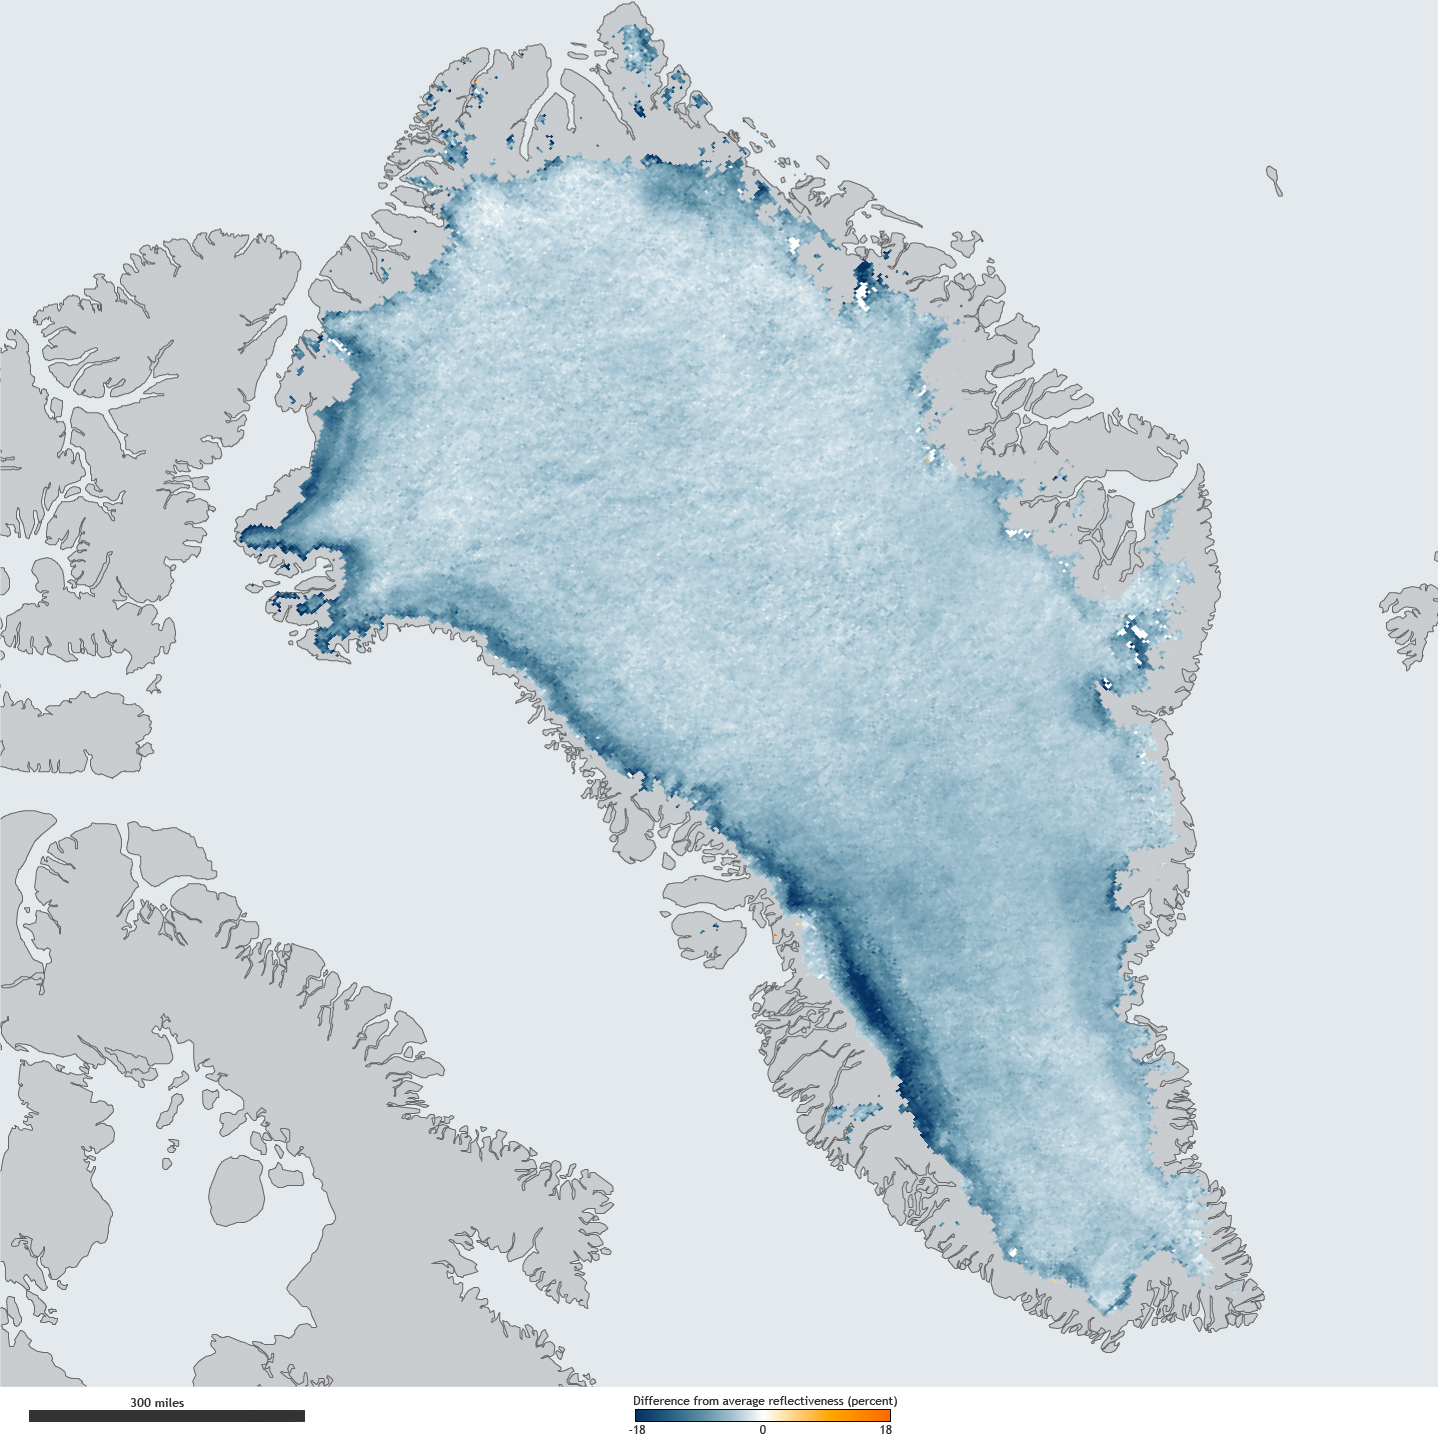
I read a fascinating article recently on the darkening of Greenland's ice sheet. NASA has been proclaiming for years that the ice is getting darker due to increased global pollution and is therefore reflecting less sunlight back into space, something that has ramifications for global warming. However, when researcher Chris Polashenski and his team analyzed Greenland ice samples to explain this darkening, they found ... nothing. Turns out there has been no darkening of the central ice sheet after all. Polashenski's explanation is that the satellite sensors on NASA's aging MODIS satellites are degrading and NASA has failed to correct for this error. I have not found any response from NASA yet, but I may have missed it.
Source
It appears that no matter how expensive and complex the measuring tools get, nothing beats boots on the ground to verify the data.

Calibrating Sensors

When I was in university, I had the privilege of working for the Canadian government doing research in preparation for the first RADARSAT satellite. When I was there in 1991, RADARSAT was still four years in the future, but the Europeans launched ERS-1 that summer and it carried the first spaceborne Synthetic Aperture Radar (SAR) system. Because Canada had a reliable airborne SAR system, we helped the Europeans calibrate their new satellite. We did that by having the satellite and the plane pass over the same stretch of eastern Lake Superior shoreline at the same time while people on the ground took measurements of the conditions that would affect radar return, such as air and water temperature, wave heights, wind speed, and so forth. The ground measurements and airborne radar images could be compared and then the ERS-1 images could be calibrated against both of them. Once calibrated to real-world data, the satellite SAR could image any other areas of the Earth's surface and the radar image could be reliably interpreted to describe the surface conditions.

Convair-580 C/X SAR
The Convair 580 C-X SAR Aircraft that helped calibrate the ERS-1 satellite in 1991. Source

The lesson I learned from those months doing radar research is that even the most complex sensors are only useful if they are calibrated against a real-world source.

Implications for Business Intelligence

As we move into the age of the Internet of Things (IoT), this problem will only become more prevalent. If we base any important decisions on a single measurement source, we stand the risk of getting fooled by a faulty sensor. Of course, it's not just technical gizmos that can fail. Any single source of data can be faulty, including someone's spreadsheet.

When I worked in the hospital sector in the late 1990's, the government funding agency sent out a spreadsheet showing how the complexity of cardiac surgery cases had mysteriously dropped during the first 6 months of that year across all cardiac hospitals in the province. As a result, they were clawing back over a million dollars in funding based on the argument that the hospitals were taking simpler cases and were redirecting the funds elsewhere. Our hospital CEO was concerned as it is no simple exercise to find money half way through a budget year. A colleague of mine was assigned to discover if this complexity drop was real, so the first thing he did was talk to the Chief of Cardiac Surgery. Were cardiac surgery cases getting simpler? On the contrary, he answered, they were getting noticeably more complex. It was the same story when he spoke to surgeons at other hospitals. My colleague then set out to uncover the discrepancy, which he eventually found as a formula error buried deep in the spreadsheet. He corrected the spreadsheet, sent it back to the government, and a few days later they sheepishly sent out the corrected spreadsheet showing a slight increase in cardiac surgery complexity across the province. The funding clawback was quietly cancelled. It was sloppy spreadsheet work on the government's part for sure, but the approach to solving the problem began by getting a second measurement source, in this case by having a conversation with a surgeon.

It reminds me of Segal's Law, which states:

A man with a watch always knows what time it is.
A man with two watches is never sure.

Every watch has a measurement error of some degree, but you are only confronted with that error when comparing to a second watch. When looking at one watch, we can easily forget about its inherent inaccuracies. NASA was looking at one watch for a decade and it was sure it had the correct time. Even the experts can make simple mistakes.

When it comes to any important business decisions that you are basing off of your BI metrics, always make sure you have a second watch.

Source: David Boettcher. Notice how these watches differ?

Friday 5 June 2015

Designing Data Cubes - Part 4

This is part of an on-going series on data cube design.  Click here for the previous article.

Use Entity-Relationship Diagrams to Guide the Dimension Design

In the previous post I discussed the need for eliminating unnecessary dimensions during the cube design phase. Once you have all the required dimensions, you need to arrange the components into hierarchies. In some cases, it's not always obvious if dimension elements belong together in the same dimension or in separate dimensions.

In an earlier post, I discussed the basics of ER Diagrams so I won't repeat that here. I have found taking the time to model the dimension elements properly makes the dimension design easier and helps avoid common design errors.

Situation 1:  Separate Dimensions

When two elements have a many-to-many relationship (such as Customer and Product), they absolutely should not be part of the same dimension. They are separate dimensions that connect to each other through the fact table. The temptation may be to put products as a child of customer so you can easily see which products each customer purchased, but when it's time to show all sales for Product A, it becomes a nightmare. I do not know of a valid exception to this principle, but I certainly have seen it ignored by new cube designers.


Situation 2:  Level-Based Hierarchy

When a series of entities are related as one-to-many going forward and one-and-only-one going backwards, they are part of the same dimension hierarchy. Further, it is a level-based hierarchy because each forward relationship is mandatory.

The example below shows part of the Canadian census geographic levels and how they are subdivided into smaller and smaller areas. While it's obvious they are part of the same dimension, working out the relationships helps determine the type of hierarchy to use.


Situation 3:  Parent-Child Hierarchy

Similar to Situation 2, entities that are related as zero-to-many going forward and one-and-only-one going backwards are also part of the same dimension hierarchy, but because it is optional at one or more levels, it is a parent-child hierarchy. Just like with families, some people have children and grand-children while other people do not. This asymmetry is not allowed in a level-based hierarchy.

The example below shows an account structure, where Account Group may be Asset, Account may be Bank Account, and Sub-account may be TD Bank Account #12345. Because one level of the hierarchy is optional (Sub-account), the entire hierarchy becomes parent-child.


Situation 4:  Member Properties (Synonyms)

This situation is not as intuitive as the previous examples, but I have seen it built improperly in cubes on multiple occasions. Entities relate to one base element in what appears to be two distinct hierarchies. The example below shows Customers rolling up to geographic regions and also through the Sales department.


Because both sets are based on Customer, it doesn't make sense to create two separate dimensions. Building one dimension with a default hierarchy and an alternate hierarchy looks like a reasonable option. However, before making that decision it is important to understand the relationships between the hierarchies. How does Region relate to Regional Sales Managers? In this case, it turns out that each RSM oversees one and only one Region, and simliarly for Sales VP's and Districts.


Since the geography and sales entities are therefore equivalent, we don't need two hierarchies. We just need alternate labels on one hierarchy. For example, in Microsoft cubes (SSAS), these alternate labels are called Member Properties. Some reports will show Districts and Regions while other reports show Sales VP's and RSM's, but the numbers in each bucket will always be identical.


I have found people who are new to cube design tend to shun data modeling exercises because it's time consuming and in some cases it appears unnecessary. However, understanding your data relationships clearly by building some simple ER diagrams can really help to design a cube that works efficiently.