However, it seems the smartest minds on Wall Street assumed EVERYTHING in the world of finance follows the bell curve. BIG mistake! As it turns out, for JPMorgan it was a $6.2 billion big mistake. Ooops. You can read about their mistake here on Slate.com. First, let me explain a few of the concepts involved and then we'll come back to J. P. Morgan's incredibly wrong assumption.
What is a Bell Curve?
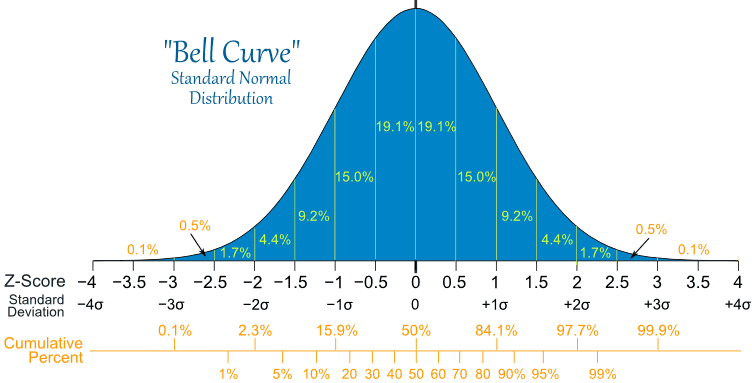
The bell curve below is from mathisfun.com. It shows that within 3 standard deviations (+/- 3 sigma) of the mean of a normal distribution, you will find 99.7% of the observations. In other words, there just aren't a lot of events that occur very far from the mean. The process improvement method Six Sigma takes its name from this concept that if you go out +/- six standard deviations from the mean, you should effectively never get any events occurring outside of this range. That is only true of course if the variations in the manufacturing process follow a normal distribution, which fortunately is usually true.
The bell curve accurately describes variations in student marks and student heights, many manufacturing processes, and even the daily movements in the stock market, but it doesn't apply to everything we find in the real world. For example, simple everyday events such as wait times at your grocery store checkout or bank teller, hospital inpatient length of stay, and the duration of telephone calls do not follow a bell curve. These events follow an exponential distribution.
What Is An Exponential Distribution?
Exponential distributions are asymmetrical (i.e. skewed to one side of the mean), limited on one side by a minimum (usually zero), and have long tails. In other words, events far from the mean can and do happen with much more frequency than in normal distributions.
My graph on the left shows one type of exponential family of curves called the Erlang Distributions, named after a Danish telephone engineer A. K. Erlang who began using them in the early 1900's. These in turn are part of a larger family of exponential functions that engineers call Gamma Functions.
What Erlang discovered is that duration of telephone calls did not follow a normal distribution. You could not have a call of zero duration or less (i.e. a minimum), but you could have an occasional telephone call that lasted hours (i.e. no practical maximum). Erlang's job was to accurately predict how much switchboard capacity was required, which he ultimately succeeded in doing.
Because of these occasional large-value events, the rules of normal distributions do not apply. For instance, you cannot presume that 99.7% of your events will fall within 3 sigma of the mean. Depending on the specific shape of the exponential distribution, a measurable and significant portion of the events will fall far past 3 standard deviations from the mean, and Erlang had to take those events into account when planning his capacity.
JPMorgan's Mistake
As stated in the article, JPMorgan got into the business of complex credit swaps and assumed they would behave according to a normal distribution."Credit default swaps simply don’t behave in line with the normal, or Gaussian, distribution typically assumed. The so-called tail risks, or the chances of extreme events, are bigger than that theory predicts. Ina Drew, who ran the CIO, referred to one day’s mark-to-market losses as an eight standard deviation event, according to the report. That translates mathematically into something that should only happen once every several trillion years. It makes no more sense than Goldman Sachs finance chief David Viniar’s famous remark as the crisis unfolded in 2007 about seeing 25 standard deviation events, several days in a row."
Of course, the mathematics DOES predict this if you use the correct exponential distribution. The credit swaps had very large potentials for one-day losses, which veer far away from the daily means, but those potentials were either ignored or just presumed to never exist. JPMorgan failed to recognize the correct distribution for their credit default products and when losses mounted they just blamed mathematics for their wrong assumption.
One cannot simply ignore the rare-but-large-value events. JPMorgan learned the hard way that with exponential distributions, the tail wags the dog.
And so JPMorgan shareholders are out $6.2 billion for that little mathematics oversight. Oops.

