Entity-Relationship Diagrams
In the mid-1970's as normalized relational databases became popular, the Entity-Relationship Diagram (ERD) emerged as a method to model and understand them. Any relational database can be modeled using an ERD, even if it is not in Third Normal Form.The most common form of ERD's contain boxes which represent tables and lines connecting them which represent joins between foreign keys. Within the boxes all of the fields are listed, with the key fields being listed first.
Here is an example of an ERD for one portion of a financial system database involving journal entries. It is only one of hundreds of such diagrams that together describe all of the tables in this financial database, but it serves as a good example for our purposes. It is far too small to be legible, but it is easy to see that there are a lot of tables (boxes) and a lot of joins (lines) between them.

Analytical Weaknesses of 3NF
The diagram above makes it apparent how Third Normal Form complicates database querying. Whenever a query involves a join, the query will take longer to process. The more joins in a query the slower it runs. If you have a business question that involves linking two fields from two different tables, the query performance will depend on where those two fields are located.For example, if the two fields are in two adjacent tables, there will only be one join necessary and the query should run quickly. The diagram below highlights a query that links the Project table to the Journal Line table.
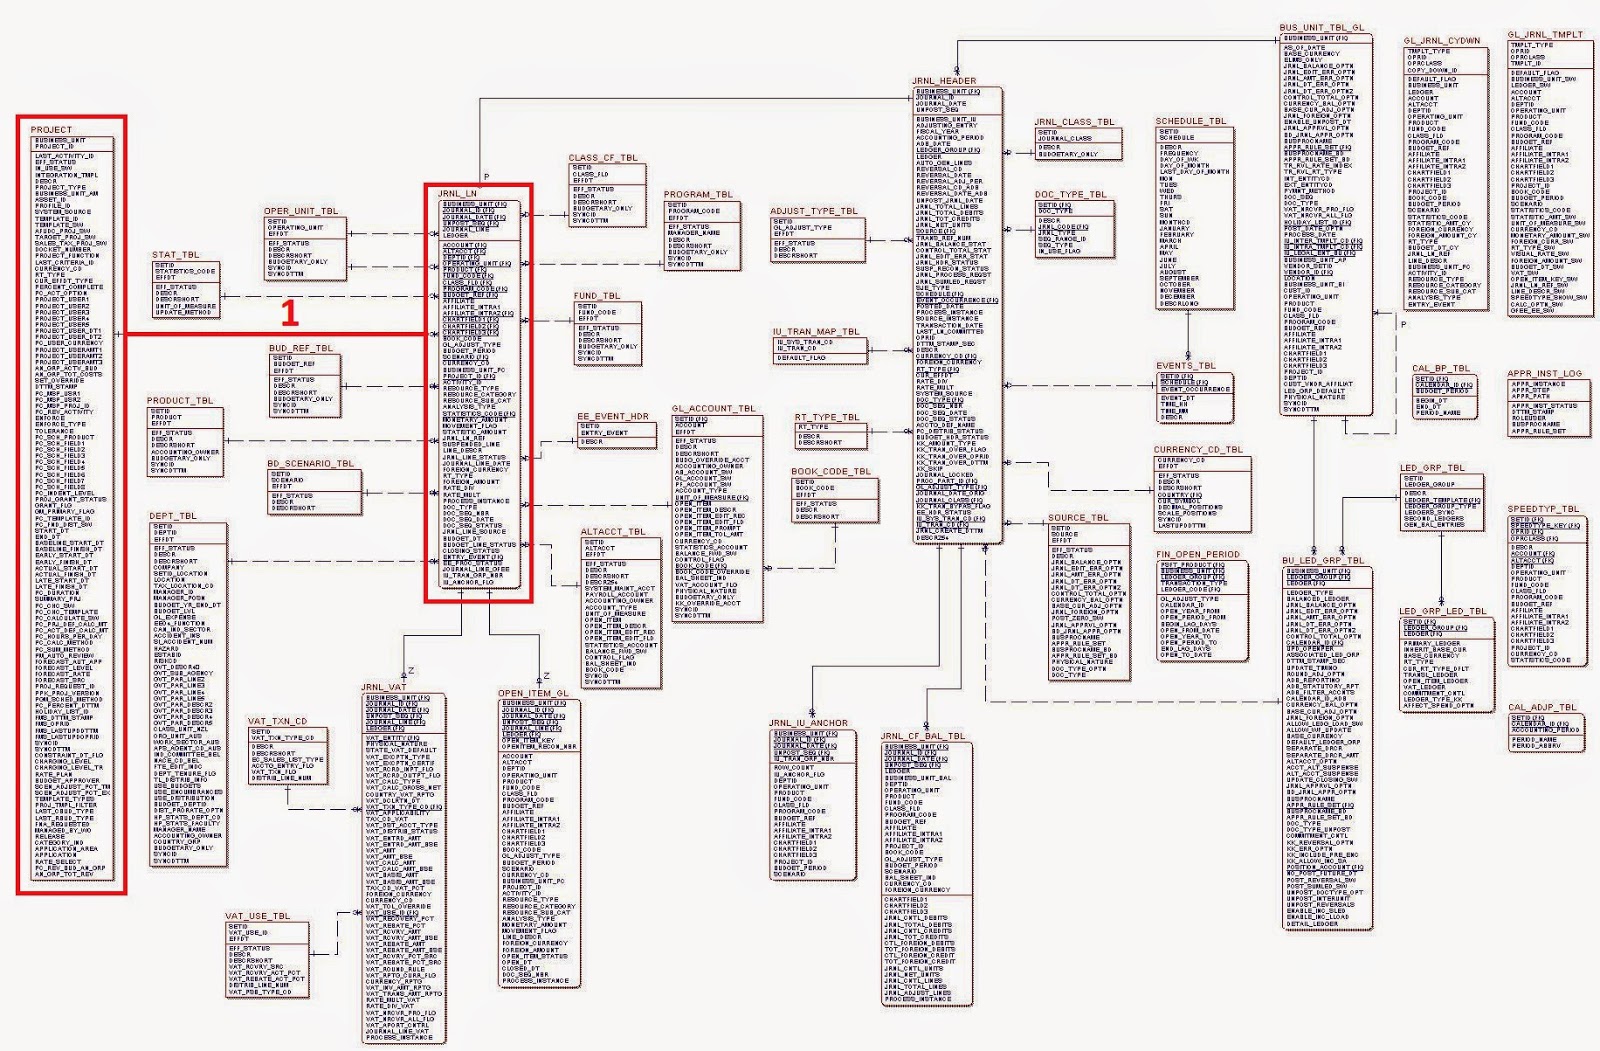
If however the two fields happen to be in the Project table and the Ledger Group table, the query will require 5 joins. The latter query will take noticeably longer to run than the first query, even though both may be valid business questions to ask of the data.

Of course, queries can have far more than 5 joins. If we consider the other 100 such ERD's in this financial system, some business questions may occasionally require fields from different modules that involve a dozen or more joins.
This inconsistent analysis query performance in 3NF caused enough of a problem that an alternative data structure was created. Enter the Star Schema.
Star Schema
Whereas 3NF treats all tables as entities, Star Schema involves two different types of tables: fact tables and entity tables.Fact tables contain records with numeric values, such as financial transactions, and foreign keys to the entities. Fact records typically are summed but occasionally they can be counted instead.
Entity tables contain descriptive data about the facts, such as department name or product details. They permit the "slicing and dicing" of the fact records.
Combined, the fact table and entity tables make up the Star Schema.

The advantage of the Star Schema is that no matter which entities you wish to query, it involves a maximum of 2 joins. In addition, any join between entities must pass through the fact table. This guarantees there will be data to aggregate for any inter-entity query.
What is not apparent from this diagram is that it is not normalized. For example, if Entity 1 contains department data, the fields may Company, Business Unit, Department and Cost Centre. While any cost centre may only appear once in this entity table, the Company, Business Unit and Department names may repeat thousands of times. This is acceptable in Star Schema as it permits faster queries and users are not updating the records. Star Schema databases are typically updated nightly using automated processes, so repeating a business unit name thousands of times is not a problem.
Isn't denormalized data inherently inefficient though? Why not try to normalize those entity tables? That's the next topic.
No comments:
Post a Comment