Showing posts with label data models. Show all posts

Friday, 29 May 2015

Designing Data Cubes - Part 3

This is part of a series on designing OLAP cubes. Click here for the last article.

Step 3 - Designing the Dimensions

So far we've looked at distinguishing the facts from the dimensions in the source data and ensuring each fact table is at one common grain. Now we can focus on designing the dimensions.

With dimensions, you really only have two main design decisions:
  • Which dimensions are required in this cube?
  • What will the dimension hierarchies be, if any?
These appear to be simple questions, but some datasets can cause confusion when setting up the dimensions. Getting the dimension design wrong can result in poor cube performance and sometimes erroneous report results.

Some dimensions are easy to design, such as Time. Everyone knows that Days roll up to Weeks, roll up to Months, roll up to Quarters, roll up to Years. However, it is not always clear which data elements belong together in one hierarchy and which ones deserve their own dimensions.

For example, the data element Sales Region rolls up to Sales District and drills down to Customer. It's obvious those elements belong together in one hierarchy. However, Sales Manager rolls up to Sales Director and also drills down to Customer. Customer is common to both potential hierarchies. Should the Sales Managers and Directors be part of the Sales Region hierarchy or should they be in their own dimension? Or should they be an alternate hierarchy above Customers in one dimension? The answer depends on the specific nature of these data elements for this particular company.

I have found there are two guidelines that have helped me answer these dimension design questions:
  1. Eliminate ALL unnecessary dimensions and hierarchy levels from the cube
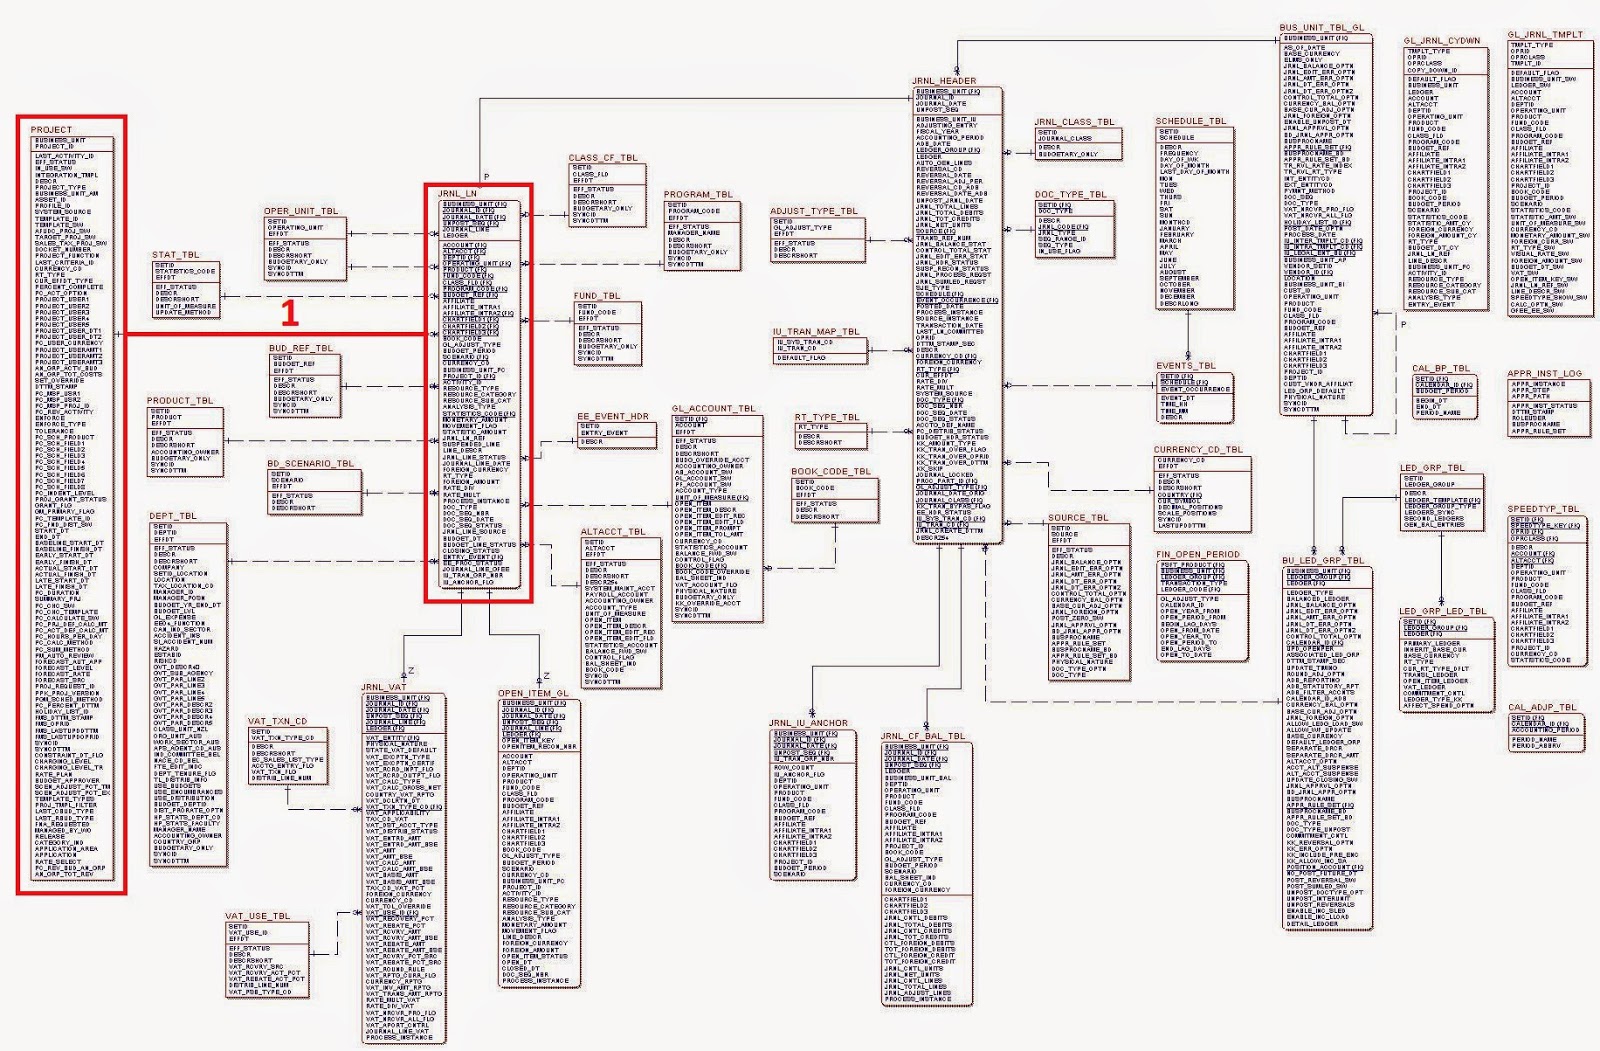
  2. Use Entity-Relationship diagrams to guide the dimension design

Eliminate Unnecessary Dimensions and Hierarchy Levels

The common temptation I have seen in many workplaces is to build a cube that can answer every ad hoc question that could ever be asked of the data. That is the worst thing anyone could do when designing a cube. Always design cubes to accomplish a particular purpose. By implication, this means the cube will not accomplish every purpose. That's OK because cubes designed to accomplish all purposes usually end up accomplishing none of them.

If none of your organization's reports contain weekly summary levels, then don't include weeks in your time dimension hierarchy. If your scheduling system books staff by the shift, then don't build a reporting cube that shows hourly schedules. Keep your cubes consistent with your business processes.

When I review cubes and ask why certain dimensions have been designed the way they are, there are some terms that can indicate unnecessary dimensions in a cube:
  • Just in case:  "We added Weeks to the Time hierarchy just in case someone would want to build a weekly report."  If no one has had a business need to build a weekly report yet, don't presume that business need is suddenly going to appear after you build your cube.
  • Future requirement: "We built hourly schedule reporting functionality because the HR manager said that they might consider moving to hourly staff scheduling in a couple years." Don't build to imagined future requirements. Build to today's requirements to ensure you meet today's requirements. Failing to meet today's requirements but meeting non-existent future requirements does not equal success.
  • One person asked for it: "We didn't see any existing reports with this dimension, but one user requested it." If that one user is the project owner who is funding this cube, then it's probably a good idea to include it. Otherwise, leave it out.
  • It was in the source data, so we put it in the cube: "We put every data element we found into the cube." This may sound comprehensive but it is too large a purpose for one cube. Most source systems have data elements that are no longer used, so including everything guarantees a cluttered cube.
Keeping the cube dimensions and hierarchies clear of clutter improves performance significantly. Be ruthless when considering what elements should be included and excluded from your cube.


The second guideline will be tackled in the next post.

Friday, 8 May 2015

Back to the Basics - Crow's Foot Diagrams

In an earlier post we touched on the topic of Entity-Relationship Diagrams (ERDs). In this post we will explain one of the more common diagramming standards for ERDs. To begin though we need to understand the types of relationships between entities.

Entity Relationships

In ERDs, entities are shown as boxes and relationships between them are shown as lines. For example, the entity Author has a relationship to the entity Book.

While knowing that a relationship exists between these entities is helpful, it would be more helpful to convey information about the nature of that relationship in the diagram. For instance, does every author have a relationship to a book or only some authors? Can a book exist without an author? Can a single author write multiple books? Can a book be written by multiple authors?

These relationship questions boil down to two that apply to every entity relationship:
  1. Is the relationship optional or mandatory?
  2. Is a single relationship or multiple relationships possible per instance of each entity?
The first question deals with the minimum number of connections (0 if optional, 1 if mandatory) and the second question deals with the maximum number of connections (1 or many). We don't try to specify a firm maximum number because whether it's 2 or 2 million, the impact on the database  design will be the same.

Many relationship diagramming methods exist for ERDs but I have found the Crow's Foot design the easiest for me to understand and the most commonly used in the companies I've worked with.

Crow's Foot Diagrams

The Crow's Foot connector uses 3 symbols to describe the minimum and maximum number of relationships:  0, 1 and < (for "many" -- I think of it as a greater-than sign)

Two symbols are used at the end of each line. The first is the minimum and the second is the maximum. There are four acceptable combinations of values as shown below.

Because the "many" symbol resembles a crow's foot, hence the name of this diagramming method.

Some people view the number zero as a letter "O" which stands for "Optional." Both interpretations are equivalent.

Now we can modify the relationship diagram for Authors and Books.

We can read the relationships in both directions. The symbol at the destination end of the line is the one that applies to that direction. These connectors show that each author writes one to many books and each book is written by one to many authors.

Note that these relationships are mandatory (i.e. minimum of one). If an author has not written any books, they cannot be considered an author. Similarly a book cannot exist without an author.

Note that the greater-than sign always means "many" even if it appears backwards (like a less-than sign).

Here is a finance example from a General Ledger data model.

In this system, financial accounts can have sub-accounts but they are not mandatory. For example, the account Office Supplies Expense may have sub-accounts called Copier Paper, Copier Toner and General Office Supplies. However the account Electricity Utility Expense has no sub-accounts because there isn't any further cost breakdown possible. This diagram reads that each account can have zero to many sub-accounts, but that each sub-account must belong to one and only one account. While sub-accounts are optional, once one is created then it has a mandatory relationship back to a single account. Sub-accounts cannot be orphans.

Next example: users and software licences.

Each user must have one and only one licence. (We will stick to the legal options only -- no pirated software!) If a person does not have a licence then they cannot be considered a user of that software. However a licence may be purchased and not assigned to any user. It may be waiting for a new hire who starts next quarter. Therefore a licence can be assigned to zero or one user.

You can begin to see that the definition of the entity can affect the definition of the relationship. The entity User contains an inherent assumption that must be understood in order for the relationship to be modeled correctly, specifically that there is no pirated software allowed.


The importance of entity definition shows up in this example as well. Here a customer buys one to many products, while a product may be bought by no one or many customers. If a person doesn't buy any of our products, they cannot be considered our customer. If however we want to track everyone who walks into our store, then we need a different model. Some people could walk in, look around and leave without buying and therefore without becoming customers. If we call everyone who enters our store "Shoppers" then that model would look like the following:

 Now the connector from Shopper to Product becomes optional.

But What About Other Combinations?

You may have noticed that selecting two values (min, max) from three different symbols (0, 1, <) should give us more than just four combinations. Obviously the maximum cannot be less than the minimum so those situations are nonsensical. However, there still are two other combinations:
  • Zero and only Zero -- this effectively means there is no relationship between these two entities and therefore no line, so it is a non-existent situation in an ERD.
  • Many to Many -- this means the minimum is greater than one. This situation sounds plausible.
In fact, it's not hard to imagine an entity relationship where the minimum is 2. Consider the diagram below for a genealogy database:

Each parent can have one to many children, but each child must have 2 and only 2 parents. (We'll stick to genetic parents for simplicity.) What Crow's Foot symbol should we use for representing a "2-and-only 2" relationship?

Whenever you encounter a situation like this, it means you need to redefine your entity definitions. You need to take the model to a lower level of detail.

In this case, we need to ask why we created an entity called Parent. Why not two entities called Father and Mother? Or Man and Woman? In genealogy software, those distinctions are bound to be important for reporting.

Once we create two entities out of the Parent entity (Father and Mother), the relationship to Child simplifies to a minimum value of one. Now our "2-and-only-2" relationship has been resolved.


It's important to know that relational databases cannot resolve a connection where the minimum value is greater than 1. Whenever that shows up in your model, you have to create additional entities to simplify the relationships so the minimum connector is either 0 or 1.

Short-Form Description of Entity Relationships

One more important point. When describing an entity relationship in words, the practice is to summarize it by focusing on the maximum connector values only. Minimum values are omitted for simplicity as they have less effect on the data architecture design.

For example, we would say the entity Author has a many-to-many relationship with Book.

Account has a one-to-many relationship with Sub-account, and Sub-account has a many-to-one relationship with Account.

 User has a one-to-one relationship with Licence.


While these little Crow's Foot symbols may seem insignificant, ERDs are incredibly helpful in understanding an organization's data and the business definition assumptions inherent in it. We will explore some applications of ERDs using Crow's Foot notation in future posts.

Friday, 24 April 2015

Back to the Basics - Snowflake Schema

In the last post we introduced the Star Schema. Next we will look at a modification of the Star Schema called the Snowflake Schema and explain why you should try to avoid it.

Snowflake Schema

The Star Schema is a de-normalized data structure designed to optimize aggregation query response times. It contains a fact table surrounded by a number of entity tables.


A common expansion of the Star Schema is the Snowflake.  A Snowflake Schema is simply a Star Schema where one or more of the entities have been partially normalized. This means some of the repeated details for an entity table have been hived off into a separate details table to reduce data repetition in the main entity table. An example of a Snowflake Schema is below.


Note that the original Star Schema tables are still there, but new Entity Details tables have been added around the edges, making it roughly resemble a snowflake.

Snowflake Schemas are rarely symmetric. Some entities may have multiple detail tables (such as Entity 1 above with 3) while other entities may have none (Entity 2).

What type of data is stored in the Entity Detail tables? Anything that is repeated frequently in the main Entity tables. Hierarchy levels or long textual description fields are common candidates for snowflaking.

For example, an Entity called Cost Center may have a hierarchy starting at the top with Company, then going down to Business Unit, Department and Cost Center. The facts are stored at the cost center level, so the Company, Business Unit and Department values will be repeated frequently in the entity table. Therefore, those details could be put in a separate entity details table called Cost Center Hierarchy with the cost center key remaining in the main entity table.

Avoid Snowflaking

Now that we've reviewed what the Snowflake Schema is, this is why you should avoid using it: Snowflaking works against the sole purpose of the Star Schema.

By normalizing an intentionally de-normalized data structure, the additional joins slow query response time in order to save a bit of disk space. This is ridiculous when the only reason the Star Schema exists is to improve query response time. Most instances where I have seen snowflaking used in real-world data models has been the result of a DBA (database administrator) returning to old habits and normalizing tables because that's what they've always done in the world of OLTP. It's a tough habit to break.

One Exception: Bridge Tables

A situation that diagrammatically resembles a Snowflake Schema is a Bridge Table, although I do not consider it snowflaking. A bridge table contains the conversion mapping logic between two related entity tables.

Consider two data marts, each with their own star schema. One mart contains sales data and the other manufacturing data. We want to connect the two fact tables through the Region entities to permit analysis of sales and production data together. One way to accomplish this is to conform the Region dimensions so sales and manufacturing use the same regional boundaries. That would permit a single entity table to be used by both fact tables. However, that is not always possible from a business perspective. Sales divides geography based on the number of customers and prospects in an area while manufacturing divides geography based on factory and warehouse locations. Forcing sales to use manufacturing's boundaries or vice-versa would create a lot of unnecessary hassles for the business with essentially no real benefits.

An alternative is to use a Bridge Table that equates sales regions and production regions. For example, Toronto may be in sales region Central East but in production region Ontario. The diagram below shows the Regions Bridge Table linking these two data marts.


Again, this appears similar to a snowflake of the Regions entities, but it actually involves no normalization so I don't consider it snowflaking.

A different definition of a Bridge Table exists that states they resolve many-to-many relationships between entities, but those situations should typically be resolved through the fact table. Bridge Tables should resolve different aggregation standards for similar entities. In addition to different geographical entities (described above), time is another frequent candidate for bridging when different data marts require different fiscal reporting periods.

Outrigger Tables

One other term that deserves comment comes from Ralph Kimball, one of the grandfathers of data warehousing and star schemas. While he strongly advises against snowflaking, he does permit some normalization of the star schema using something he calls Outrigger Tables. I will let him define it from his website:

"A dimension can contain a reference to another dimension table. For instance, a bank account dimension can reference a separate dimension representing the date the account was opened. These secondary dimension references are called outrigger dimensions. Outrigger dimensions are permissible, but should be used sparingly. In most cases, the correlations between dimensions should be demoted to a fact table, where both dimensions are represented as separate foreign keys."
One of Ralph's colleagues, Margy Ross, elaborates further:
"Outriggers are similar to snowflakes in that they’re used for many-to-one relationships, however they’re more limited. Outriggers are dimension tables joined to other dimension tables, but they’re just one more layer removed from the fact table, rather than being fully normalized snowflakes. Outriggers are most frequently used when one standard dimension table is referenced in another dimension, such as a hire date attribute in the employee dimension table."
Margy continues:
"Like many things in life, outriggers are acceptable in moderation, but they should be viewed as the exception rather than the rule. If outriggers are rampant in your dimensional model, it’s time to return to the drawing board given the potentially negative impact on ease-of-use and query performance."
While I agree with Margy that outriggers should be used sparingly, I fail to see a distinction between snowflaked tables and outriggers. The only apparent difference is that if snowflaked tables are small, then we can call them "outriggers" and they become permissible. I don't see the need for such a distinction. Snowflakes are snowflakes, even though they come in different sizes.

Avoid snowflaking at all costs. If there are too many outriggers or bridges in your model, it usually means the fact table is the problem and it needs to be split into two (or more) fact tables. Further discussion about cube design will follow in a later post.

Friday, 17 April 2015

Back to the Basics - Star Schema

In the last article we covered OLAP and OLTP. This article looks at the data models that support those two data structures.

Entity-Relationship Diagrams

In the mid-1970's as normalized relational databases became popular, the Entity-Relationship Diagram (ERD) emerged as a method to model and understand them. Any relational database can be modeled using an ERD, even if it is not in Third Normal Form.

The most common form of ERD's contain boxes which represent tables and lines connecting them which represent joins between foreign keys. Within the boxes all of the fields are listed, with the key fields being listed first.

Here is an example of an ERD for one portion of a financial system database involving journal entries. It is only one of hundreds of such diagrams that together describe all of the tables in this financial database, but it serves as a good example for our purposes. It is far too small to be legible, but it is easy to see that there are a lot of tables (boxes) and a lot of joins (lines) between them.

Analytical Weaknesses of 3NF

The diagram above makes it apparent how Third Normal Form complicates database querying. Whenever a query involves a join, the query will take longer to process. The more joins in a query the slower it runs. If you have a business question that involves linking two fields from two different tables, the query performance will depend on where those two fields are located.

For example, if the two fields are in two adjacent tables, there will only be one join necessary and the query should run quickly. The diagram below highlights a query that links the Project table to the Journal Line table.

If however the two fields happen to be in the Project table and the Ledger Group table, the query will require 5 joins. The latter query will take noticeably longer to run than the first query, even though both may be valid business questions to ask of the data.


Of course, queries can have far more than 5 joins. If we consider the other 100 such ERD's in this financial system, some business questions may occasionally require fields from different modules that involve a dozen or more joins.

This inconsistent analysis query performance in 3NF caused enough of a problem that an alternative data structure was created. Enter the Star Schema.

Star Schema

Whereas 3NF treats all tables as entities, Star Schema involves two different types of tables: fact tables and entity tables.

Fact tables contain records with numeric values, such as financial transactions, and foreign keys to the entities. Fact records typically are summed but occasionally they can be counted instead.

Entity tables contain descriptive data about the facts, such as department name or product details. They permit the "slicing and dicing" of the fact records.

Combined, the fact table and entity tables make up the Star Schema.


The advantage of the Star Schema is that no matter which entities you wish to query, it involves a maximum of 2 joins. In addition, any join between entities must pass through the fact table. This guarantees there will be data to aggregate for any inter-entity query.

What is not apparent from this diagram is that it is not normalized. For example, if Entity 1 contains department data, the fields may Company, Business Unit, Department and Cost Centre. While any cost centre may only appear once in this entity table, the Company, Business Unit and Department names may repeat thousands of times. This is acceptable in Star Schema as it permits faster queries and users are not updating the records. Star Schema databases are typically updated nightly using automated processes, so repeating a business unit name thousands of times is not a problem.

Isn't denormalized data inherently inefficient though? Why not try to normalize those entity tables? That's the next topic.